Almost three quarters of the surface of our planet is water. That sounds like there’s plenty, but only 2.5% of that is drinkable fresh water. And much of that is tied up in glaciers and ice sheets, or trapped underground in inaccessible aquifers...
The amount of fresh water available for human use is of utmost importance. Until the recent rainfall which ended a drought in Cape Town, South Africa, the government there had been desperately planning for Day Zero: the day when the city's water supply would run dry. So knowing where the fresh water is, and where it's going, is enormously important when planning for the future.
Now, using data gathered by the Gravity Recovery and Climate Satellite (GRACE) from 2002 to 2016, a team at NASA Goddard Space Flight Centre were able to measure trends in the amount of freshwater in any particular region, once they had accounted for the change caused by the seasons.
"We found eight were associated with climate change, 14 associated with direct human impact, water management in particular and groundwater pumping and only 12 of them were caused by natural variability alone," says Chief of the Hydrological Science Laboratory at NASA Goddard, Matthew Rodell.
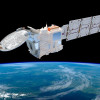
GRACE is a unique satellite system for two reasons. The first is that it doesn’t use electromagnetic waves, like light or radio, from the planet to make its measurements. The second is that it’s actually a pair of satellites.
The two fly about 220 km apart in an orbit that takes them over the Earth’s poles, and they measure the distance between themselves. When one satellite passes through an area of high gravity, it gets pulled ahead of the other slightly. This change is registered and can be used to build up a map of Earth’s gravity field.
Using this system, the NASA team were able to confirm changes in water availability that were known anecdotally, such as in northern India, but were also able to spot previously unknown changes, like groundwater depletion happening in Northern China.
The largest changes, both gains and losses, occurred in Antarctica. The increases in freshwater were likely caused by snow accumulation, whereas the losses were likely due to the impact of climate change.
The cause of these changes in the amount of freshwater has a variety of causes. Many are caused by, or likely to have been caused by climate change. There were, however, several other factors. An increase of freshwater in Eastern China was likely due to the filling of the Three Gorges Dam, and other reservoirs.
By looking at how much any trend looks like a straight line on a graph, also called its “coefficient of determination”, the team were able to make inferences about how lasting, or temporary, any trend might be.
"People are somewhat addicted to groundwater use for irrigating agriculture, so it would take a substantial change, perhaps a policy change or a great improvement in water use efficiency in order for those trends to diminish," explains Rodell.
An understanding of this model and an awareness of freshwater availability across the globe is vitally important. The knowledge that a place may be running out of freshwater will help local governments plan for their future.
Commenting on the results, which are published in the journal Nature, Rodell emphasises the crucial importance of water to human existence, pointing out that "it's critical we have an understanding of how freshwater availability is changing and this is the first time we really have a global map of how those changes have been occurring."


Comments
Add a comment